 Suzanne Gerber

by Tom Hammond and Mauri Pelto, Professor of Environmental Science
The project measures a variety of glaciers across the North Cascades — from the south end of the range on Mount Daniel to the north end on Mount Shuksan; and from the West side on Kulshan (Mount Baker) to the dry East side on the Ice Worm Glacier (aka Hyas Creek Glacier). The glaciers are a critical resource in the region, providing water for farm and crop irrigation, hydropower, salmon and other wildlife, along with municipal supply.
For 32 consecutive summers, Mauri investigated the glaciers of the North Cascades. During the three decades of research, he's seen a range-wide loss of 25% of glacier volume. This year was particularly notable as the warmest on record with very low snowpack. This led to record low streamflow from rain, groundwater and snowpack from non-glacier areas. In turn, the warm temperatures led to an increase in runoff from glacier-fed basins — but how many more summers will these glaciers survive? In this article, written by Tom and Mauri, you’ll learn about how they measure these glaciers and what their recession means for recreationists. - Suzanne Gerber, Publications Manager
Measuring Glaciers
Glaciers owe their existence to rates of snow accumulation that exceed rates of melting. The North Cascades holds the record for greatest observed annual snowfall. If climate cools and/or snowfall increases dramatically, accumulation increases, which forces the glacier to expand and advance — as all glaciers on Mount Baker did between 1950 and 1980. When melting exceeds accumulation due to warmer and/or drier conditions, the glacier loses mass by retreating at the terminus and/or thinning, as has occurred on the same Mount Baker glaciers from 1980-2015. Since glaciers record climate 24 hours a day, year in and year out, they have long been recognized as key climate indicators.
The glaciers we measure are all in Wilderness areas, so no motorized vehicles or equipment is used in gathering the data and doing the science. This means we hike (or ski) everything in and out. In the course of this study, we’ve spent over 600 nights in tents, hiking/skiing over 4000 miles across glaciers, eating countless packets of oatmeal to get us started each day. On these trips, we’ve observed wildlife and wildflowers too. There’s been an increase in mountain goat herds in several areas, and a decrease in ice worm populations. In addition, this study has provided the opportunity to train and work with more than 60 different scientists.
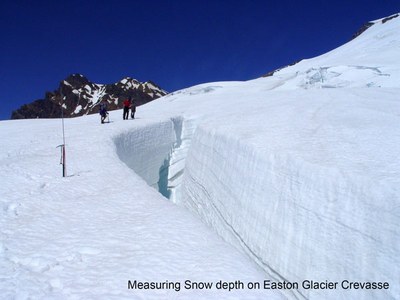
To collect our data, we measure the glacier mass balance — this is the difference between annual snow and ice accumulation and snow and ice melt on a glacier. The NCGCP has done this on the same ten glaciers every summer over the course of 32 years (and counting): Cache, Columbia, Daniels, Easton, Foss, Ice Worm, Lower Curtis, Lynch, Rainbow, and Sholes. We hike from crevasse to crevasse measuring the snowpack on the crevasse walls and assessing their depth. Analogous to reading tree rings, the thickness of each year’s snow layer is evident. We place stakes in the glacier to measure ice melt and additional data is gathered by directly measuring snow-depth with a heavy-gauge steel probe that’s about four meters long. It can penetrate ice lenses and other seasonal events, while stopping hard at the surface of the previous year. Our snow depth probe is used even more for finding our way safely through the crevasses. In the 600-plus days on these glaciers, we haven’t had a single crevasse incident.
In the field
Fieldtrip 1: August 1984 — As the heat of the day begins to dissipate, it’s time to hike into our very first glacier of the project, the Columbia Glacier. We are at the Blanca Lake trailhead, a modest pullover along the side of a forest service road — not the current trailhead. We were the only car. The ensuing three hours of switchbacks took us to the first snow patches at Virgin Lake, salmon berries by Blanca Lake, a very cold ford across the lake outlet, and a bushwhack through alder on the way around the lake. The avalanche fans were filled with snow that was not going to melt that summer. The marmots were free to roam the open alpine meadow laced with melt streams that cascaded from above. The glacier rose in a convex front dramatically above a small ridge over which a magnificent waterfall plunged.
Fieldtrip 210: August 2015 — At the same time of day, 32 years later, we park at a packed Blanca Lake Trailhead and head up to the glacier. It’s approximately our 210th hike into to a North Cascade glacier for observations. We passed lots of descending day hikers. There was no snow at Virgin Lake, and the lake was no longer draining. The salmon berries had passed, the shore of the lake by the outlet was a mess, littered with intertubes, paper towels, food wrappers, and balloon pieces. At the far end of the lake we set up camp in the usual area, no longer a meadow, as alder and fir have developed a young forest that the marmots do not find as appealing. There was no snow in the avalanche chutes and the glacier’s shallow, concave front was dirty and snow-free ending in a newly expanding lake, a good distance from the ridge. The changes are striking.
 Glacier change over time
If you were born a century ago you would have observed that there were more glaciers in the Pacific Northwest — and that they were larger. However, this was during a period of retreat, just after the Little Ice Age, when glaciers of the Pacific Northwest were experiencing substantial retreat from 1900 to 1945. Terminal retreat averaged 1400m among larger Mount Baker glaciers, 1200m for 38 other North Cascade glaciers we examined, and 1900m for the Nisqually Glacier on Mount Rainier.
This 20th century’s second substantial climate change began in the mid-1940s, when conditions again became cooler and precipitation increased — initiating an increase in mass balance and the advance of some (but not all) North Cascade glaciers.
The Coleman Glacier on Mount Baker was noted to be advancing in 1948 along with all of the mountain’s major glaciers, by 480m on average. Major Cascade glaciers such as the Easton, Lower Curtis and Eldorado became more crevassed as they accelerated and advanced. Most small North Cascade glaciers did not advance, but the large, steep glaciers generally did.
The difference is that the faster a glacier moves, the faster its response to climate change. Factors causing rapid movement include steeper slopes, high elevation accumulation zones, thick glacial ice, and a narrow terminus. Glaciers that are slow to respond generally lack several of these characteristics. For instance, the flattest glacier on Mount Baker, the Easton, was the last to begin advancing after the 1940s and the last to begin retreating after the 1970s.
Global Warming Effects from 1970 to 2015
Between 1970-2012, climate observations in the Pacific Northwest showed an accelerated warming of approximately 0.2°C per decade (Abatzoglou et al, 2014). By the mid-1980s, all the Mount Baker glaciers that had been advancing in 1975 were again in retreat. As of 2005, all 42 remaining glaciers were in retreat and five glaciers we observed had melted completely away, including the Lewis in 1990, Milk Lake in 1992, Lyall in 1994, North White Chuck Glacier in 2001 and Spider Glacier in 2005. This pattern of retreat is not confined to the North Cascades. From Alaska to California retreat has been substantial in every mountain range.
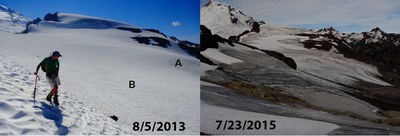 Glacier retreat in 2015 was the most extensive we’ve observed in a single year. Easton Glacier retreated 40m, Lower Curtis Glacier 35m, Columbia Glacier 27m and Sholes Glacier 25m — all single year records during our 32 years of observations — and each amounting to more than 10% of the total retreat in that period. During the course of this study, there were 22 years of negative mass balance, five years of break-even, and five years of positive mass balance. However, the positive mass balance years only increased by small fractions of a meter. On average, yearly loss has only been about one-half meter per year — but with summers like this, that number will grow fast and more glaciers will disappear.
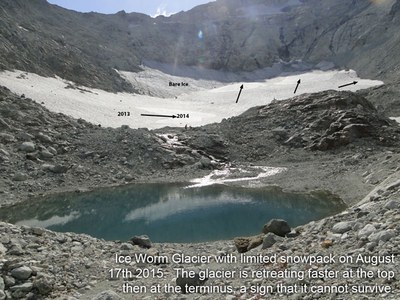
Forecasting glacier survival
We did not anticipate developing a model for glacier survival when we started this study in 1984. When climate warms, a glacier responds by retreating (losing the lowest and warmest region of the glacier). If this retreat does not stabilize at some point, the glacier is considered to be in disequilibrium and the glacier will ultimately disappear. That is, unless a glacier is high enough to support an accumulation zone given the current conditions.The clearest symptom of disequilibrium is thinning of the upper portion of the glacier, which indicates a lack of a consistent accumulation zone where at least part of the year’s snowfall can survive through the following melt season. In order to survive, a glacier needs 60 - 70 percent of its area to be an accumulation zone. Of the North Cascade glaciers we have been mapping, 75% are thinning as much in the highest areas (former accumulation zones) as near the terminus, indicating they are in disequilibrium and destined to melt away for good.
In 2015, of the nine glaciers we examined in detail, six had less than 2% retained snowcover, which was gone by the end of August. Two more had no 2015 snowpack greater than 1.7m in depth, which also melted away before the end of summer. Average ablation through melting or evaporation during the August field season was 7cm per day of snow, and 7.5cm of ice. Only Easton Glacier will retain snowcover at the end of the summer. The lack of snowcover is evident on every glacier.

A glimpse into the future
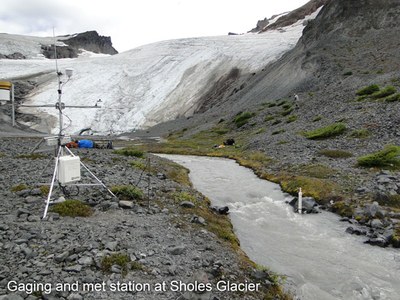
Because the glaciers this year had mostly ice, not snow at the surface, melting was enhanced. We found during a three week period in the Skykomish Basin that glacier runoff was 12% of the total flow despite covering only 1.3 % of the basin. The North Fork Nooksack glacier runoff was 74% of the total flow and only 6.1 % of the basin has glacier cover. In both cases the glaciers contributed a river flow percentage 12 times greater than the percent of basin area they cover.
The changes felt by the White Chuck Glacier may provide a glimpse into the future of other struggling glaciers in the North Cascades. The original USGS topographic map of the White Chuck Glacier shows northern and southern branches, each with separate accumulation zones, joining shortly above the terminus. At the peak of the Little Ice Age, the combined White Chuck Glacier covered an area of 4.8 km2 and in 2015 it was reduced to 0.4 km2.
The effects of this dramatic change upon local hydrologic and biological processes are profound, and the cumulative effects throughout the Cascades is even greater. Glacier runoff from July-September declined 90%. Several new alpine lakes have formed where there used to be glaciers. There’s was a loss of 0.55 and 0.65 cubic meters/second for the Whitechuck River during the July-September period. The water was less sediment-laden and warmer meaning less water for the fall salmon runs, and less food for stream invertebrates, on which salmon feed downstream in the Sauk and Skagit Rivers. One glacier that fed this watershed has already disappeared — the Milk Lake Glacier — last seen in the 1990’s.
Between 2009-2015, warm weather generated a rise in stream temperature by at least 2˚C in the Nooksack River basin. As the glaciers continue to retreat the North Fork will trend first toward the more limited impact of the Middle Fork and then the highly sensitive South Fork where warm weather leads to declining streamflow affecting the salmon population.
The Nooksack Salmon Enhancement Association has completed numerous salmon restoration efforts, but climate is one challenge that cannot be restored locally. The reduction of the glacial melt component augmenting summer low flows is already resulting in more low-flow days in the North Cascade region.
What it means for recreationists
The reality of decreased mass balance for glacier travel is limited snowpack late in summer, leading to challanging and sometimes more dangerous terrain. It reduces and in some cases, eliminates the opportunity for skiing on a glacier. We used to complete most of the measurements on skis in August, but a series of years from 2001-2005 made it clear skis were no longer productive with the diminished snowpack. The resulting glacier thinning leads to fewer crevasses as a glacier slows down, however, melting can also expand the width of crevasses and more importantly expose them as the veneer of snow bridges is removed.
This year, every crevasse was exposed early and widened by the long melt season, making navigation difficult. The reduced area of glacier coverage leads to greater exposure of unconsolidated glacial deposits that must be crossed, new lakes in basins that can impede access and steep new exposed bedrock at the head of many glaciers.