On October 13, 2015, The Mountaineers sent a survey to 4781 people who volunteered with us in the past year (we have about 1700-2000 volunteers at any given time). This included people who volunteer with us as leaders, course instructors, committee members/branch administration, event support, help for our youth programs, the lodges, stewardship volunteers, Mountaineers Players and on the Board or Advisory Council.
Why do we do this? Because we care. We want the experience of volunteering for The Mountaineers to be one you enjoy and value. You make our club a part of your life and we are humbled by that gift. We want you to take something positive away from the experience.
As a volunteer-led organization, this information informs our volunteers as they make changes in their programs. Get in touch with us if you would like help developing a survey for your committee. Our account for leaders with SurveyGizmo has some powerful analytic and reporting tools we can help you with!
OVERVIEW
In total, 488 people responded to the survey, giving us a 10% response rate and a statistically representative measure of people are feeling.
It was a long, extensive survey asking about experiences as a volunteer. We can use it to compare to a previous all-volunteer survey earlier in the year to help us refine and tailor our programs with more success.
Below is a summary of some general observations and an overview of the "State of the Volunteers." If you'd like to dive into all the data (there is a LOT). Feel free to check out the entire report here:
October 2015 Volunteer Survey Report
Our volunteer Profile
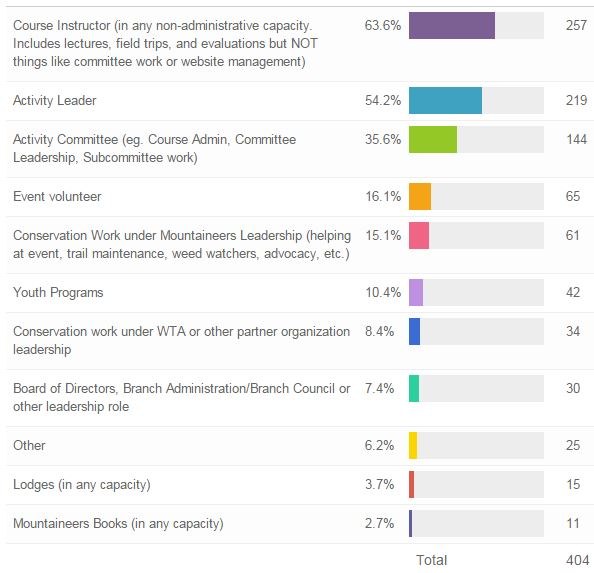
401 people said how they volunteer with us:
- 63.6% of them had volunteered as course instructors
- 54.1% of them had volunteered as activity leaders.
General Satisfaction of Mountaineers Volunteers
Trends
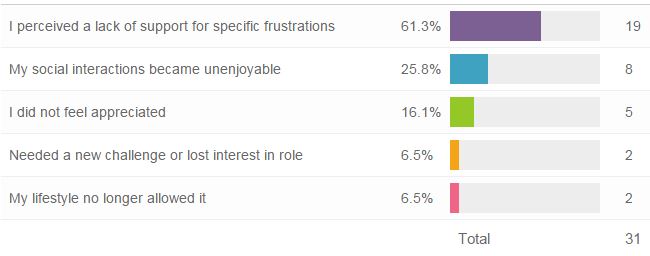
We are very proud to report we achieved a significant drop in the number of people who reported a decrease in their satisfaction level over the past year (down from 14% to 10%). When we asked people what they attributed their decrease in satisfaction to, their answers fell into the following general themes, most of which involved discrete issues related to committee or course administration:
Volunteer Perceptions of Support
We were also pleased to find out that there was a 10% increase in people who reported that they always knew who to go to for support when they needed it (from 46% to 56% in the past 8 months), with 92% of volunteers reporting they knew who to go to all or "most" of the time. 27 people felt they only knew who to ask for support "some" of the time and 4 people reported not knowing who to ask (email us at Member Services, we'll help you figure it out!). This is promising because it shows that we have increased awareness of how our organization's structure and governance works among our volunteer base.
At the same time, however, 52.6% of volunteers were not knowledgeable about their branch leadership. Of those volunteers who did not know their branch leadership, only 16.3% thought it would be useful to have more interaction with Branch Leadership. 30.1% felt that their work was not affected by it. This may be a sign that many volunteers' needs are being met without having to access that level of governance. Please keep this governance model in mind, however, when working with your leaders and course instructors, especially when fielding their ideas for innovation and improvement.
Reasons Mountaineers' Volunteers take on or leave their roles
The typical happy (and challenged) volunteer will take on different roles in their "volunteer lifespan." In this survey, 64.3% of respondents reported taking on a new role in the past year and 27.6% said they stopped volunteering in one or more ways. This is natural - and healthy. But we certainly like seeing more people taking on new roles than moving away from ones they've had.
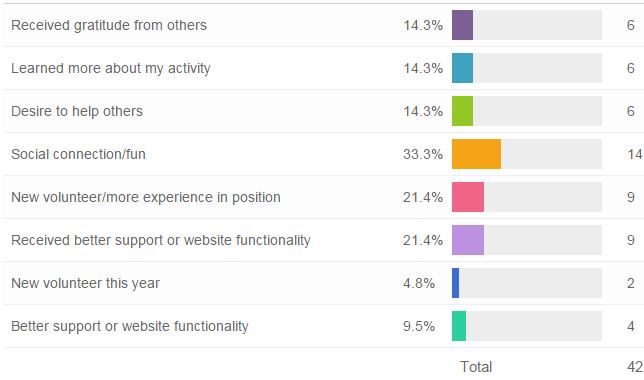
Why did you take on a new role with The Mountaineers?
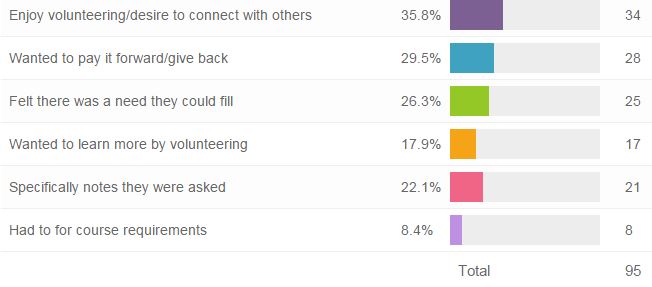
Of the people who reported that they'd taken on a new role in the past year, the following reasons were identified (you'll notice that the percentages add up to more than 100% - that's because some people identified more than one reason):
Do any of these findings spur throughts on how we can better create meaningful volunteer jobs that people will enjoy and want to fill?
Reasons people changed or dropped roles
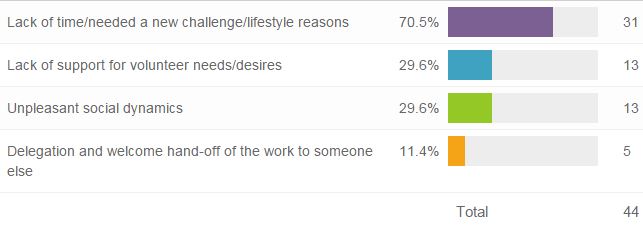
Of the people who reported that they'd stopped volunteering in a specific role, the vast majority reported lifestyle reasons - which we respect and want to support as an organization.
Feedback to volunteers and recognition
Most of our volunteers receive some sort of feedback from students and participants, helping them to evaluate and improve their efforts. The vast majority of volunteers reported this feedback made them feel good (81.2%) and/or helped them improve (33.1% of people also checked this box). There were still, however, 24.2% of respondents who reported receiving no feedback, which can contribute to a negative volunteer experience.
If you were not aware, please remember feedback from participants has been systematized with respect to trips, courses, and events, which you can access through the activity and course histories in your profile.
Just like in the last survey, our leaders overwhelmingly indicated they prefer "personal or professional growth opportunities" to other methods of thanks such as "praise and recognition" or "physical gear" (which, this time around, tied for 2nd place). Since hearing this feedback in the last survey, we began dedicating resources to connecting volunteers with development opportunities like the Wilderness Risk Management Conference and encouraging committees to make similar investments such as Seattle Climbing's sponsorship of AMGA single-pitch trainings. Know of a great development opportunity for our volunteers? Please let us know!
Demographic Overview of our volunteers
Our volunteers cross a wide variety of demographic markers. In general, they tend to be experienced Mountaineers, with 65.7% of those responding having 5 or more years of experience in the organization and 75.5% indicating they had taken 3 or more courses with us.
Our volunteers trend more male (64%) than female (35.3%), a slightly higher difference than reported in February (60.8% compared to 37.3%). They are also overwhelmingly white (88.8%) and not representative of the overall Washington state population (80.7%) - especially in light of the fact that King County is only 70.1% white (where over half of our membership resides). I note, however, that there was a 1% decrease in the percentage of respondents who identified as "non-hispanic white or euro-american" this time around.
When asking people what suggestions they had for creating a more welcoming/inclusive environment for under-represented groups in The Mountaineers, there were a wide variety of responses. However, the idea for doing this that got the most agreement from people was starting with youth. Sign up to volunteer with some kiddos today!
areas for focus and improvement
- 24.2% of respondents reported they received no feedback about their volunteer work. This can contribute to a negative volunteer experience and best practices would call for filling this gap in our volunteer programs across the organization. We encourage our Staff, Course Chairs, Committee Chairs, Branch Chairs and Board Members to think about meaningful ways you personally can provide feedback to your volunteers. Also remember that we have systematized making feedback available to leaders with respect to trips, courses, and events, which you can access through your activity and course histories in your profile.
- Volunteers in our outer-branches reported slightly lower levels of satisfaction with their volunteer experience than volunteers in our Seattle branch (overall, their experience was still positive).*
- Women reported slightly lower levels of satisfaction with their volunteer experience than men (overall, their experience was still positive).*
*Both of these metrics deserve important consideration and follow-up. In beginning to explore the causes, however, not all of the differences between these reporting categories were statistically significant (i.e. not enough people answered some questions in ways that gave us data we could reliably act on). So, for example, "support from branches or committees" was not clearly associated with these outcomes. In addition, volunteers from non-Seattle branches perceived a higher level of support from staff than Seattle volunteers.
- A number of people rejected the idea that focusing on making the organization inviting to under-represented groups was important. 11.4% said there was "no need" to do so and 3.4% said this was not part of our mission. Sometimes, this was attributed to a statement that the outdoor experience naturally renders all participants equal to each other and the awesome power of nature. This is a good point and was clearly intended to be positive. We respectfully challenge everyone, however, to consider our stated mission to help:
people explore, conserve, learn about and enjoy the lands and waters of the Pacific Northwest and beyond
Many believe this means ALL people, not just the people who show up at our doors. We must remain on guard against subconscious prejudices we aren't aware of and the micro-aggressions that can result from them (for example, "did your husband get you into hiking?"). Everyone has some biases, whether they want them or not. We must strive to be aware of them so that we ensure a welcoming environment for an increasingly diverse American population to access and support the outdoors through our programs.
- There were a number of responses indicating some members are just unaware of the many different programs we offer across the organization. For example, one respondent suggested that "hiking" was beneficial and we should begin a "hiking program." Other similar examples illustrated the need to improve communication across the membership.
 Chris Williams
